This article outlines a practical approach to simulating adversary techniques, collecting security telemetry, and validating detection rules using M&NTIS Platform, Atomic Red Team, Azure Arc, and Microsoft Sentinel.
It is intended for detection engineers who want to structure their detection engineering workflow, increase confidence in their rules, and continuously improve their coverage.
1. Introduction
Security teams invest heavily in building analytics rules in Microsoft Sentinel, but many of these rules are never tested against realistic attacker behavior. As a result, you may think you’re covered for certain MITRE ATT&CK techniques, when in reality your detections won’t fire when you need them most.
In this article, you’ll learn how to:
- Use Atomic Red Team tests as controlled “attack stimuli”
- Execute them safely inside a M&NTIS Platform lab environment
- Forward the resulting telemetry to Microsoft Sentinel via Azure Arc
- Validate that your Sentinel analytics rules trigger as expected
By the end, you’ll have a repeatable workflow to continuously validate and improve your Sentinel detections using M&NTIS.
2. Architecture Overview
At a high level, the workflow looks like this:
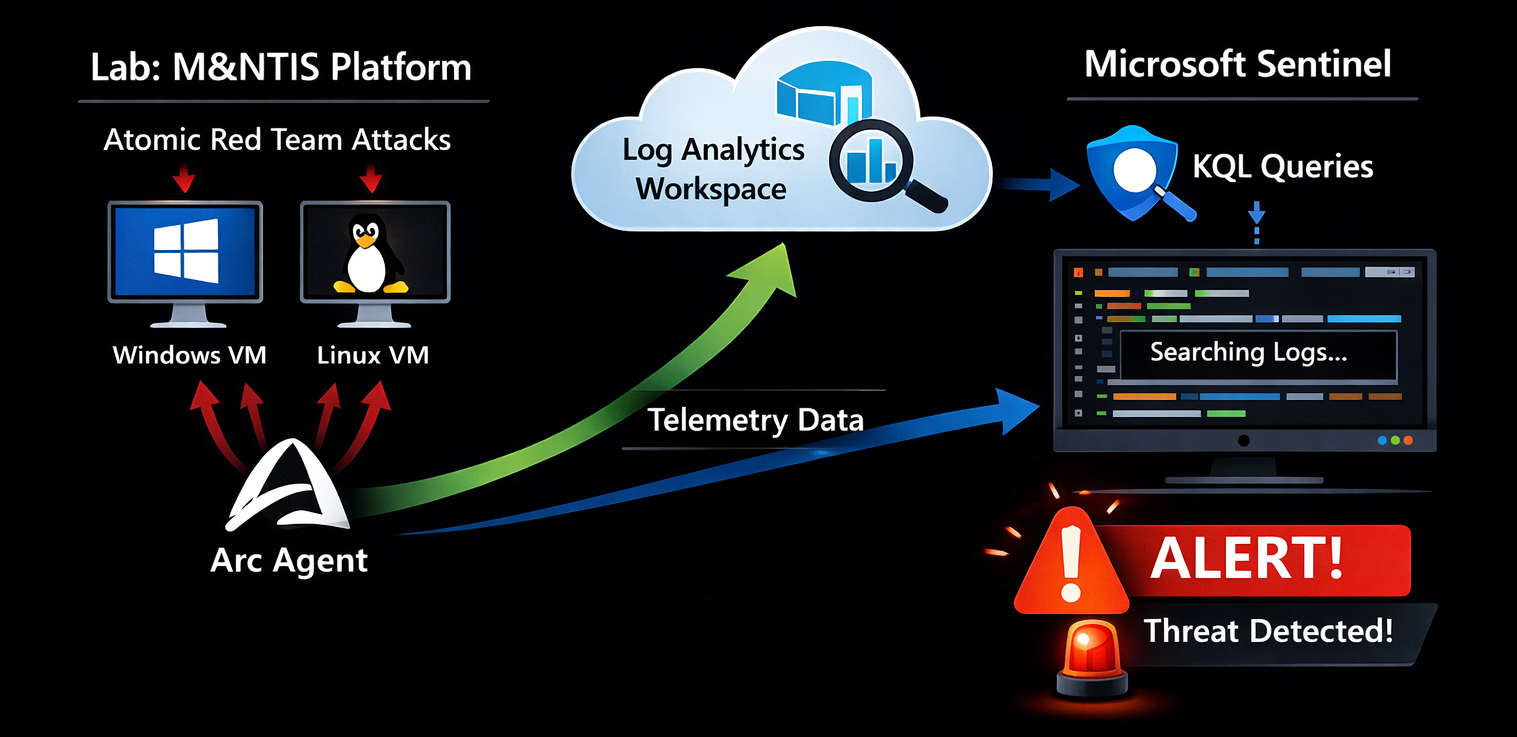
- M&NTIS Platform hosts on-demand lab representing topologies with Windows / Linux machines.
- Once labs are launched, these machines are automatically onboarded as Azure Arc–enabled servers into your Azure tenant, and Sysmon gets installed on Windows machines.
- Telemetry from these machines (Windows Security, Sysmon, Syslog, etc.) is sent to your Log Analytics workspace.
- Microsoft Sentinel uses this data to:
- Trigger analytics rules and run KQL queries
- Generate incidents
- Inside M&NTIS you execute Atomic Red Team tests on the Azure Arc–connected machine(s) through a M&NTIS Redteam beacon serving as Atomic executor.
- M&NTIS can then retrieve alerts from the Sentinel API and correlate them with the triggered attacks.
3. Prerequisites
Before you start, you should have:
- A Microsoft Azure subscription with:
- A Log Analytics workspace
- Microsoft Sentinel enabled on that workspace
- Access to M&NTIS Platform through its CLI (Command Line Interface)
- Basic familiarity with:
- Sentinel analytics rules and KQL (Kusto Query Language)
- The concept of Atomic Red Team tests
4. Introducing Atomic Red Team and M&NTIS Integration
4.1 What is Atomic Red Team?
Atomic Red Team is an open-source library of small, focused tests mapped to the MITRE ATT&CK framework. Each test (an “atomic”) simulates a specific technique or sub-technique, for example:
T1059.001– PowerShell one-linersT1003– Credential dumping attemptsT1047– Windows Management Instrumentation (WMI) abuse
Characteristics:
- Tests are defined in YAML files.
- Each test includes:
- A description
- Prerequisites
- Execution steps (commands to run)
- Cleanup steps
Atomic tests are focused on being safe and repeatable, not fully realistic malware.
4.2 How M&NTIS Platform Uses Atomic Red Team
In M&NTIS, Atomic Red Team tests are executed through
the M&NTIS Redteam beacon, which acts as the execution
engine for Atomics. This beacon is automatically deployed
during lab startup, when using the
compromission_overload directive in the lab
configuration (see below).
Therefore, you do not need to install or manage any separate Atomic Red Team agents on endpoints. M&NTIS handles the orchestration and execution of Atomics entirely through its integrated beacon.
4.3 Current Atomic Support by M&NTIS
M&NTIS Platform currently provides partial support for the Atomic Red Team format.
Not supported:
- Variables:
input_argumentsare ignored (no parameter substitution). - Dependencies / prerequisites:
dependencies,dependency_executor_name,get_prereq_command,prereq_commandare not executed. Any required setup must be done manually. - Cleanup:
cleanup_commandis not run; cleanup must be handled manually. - Target platforms:
supported_platformsis not enforced; operators must ensure tests match the target OS.
Executor & privileges:
- Only the PowerShell executor is supported
for Atomic tests.
elevation_requiredis not validated, but you can run a M&NTIS Redteam beacon with elevated privileges via lab configuration in M&NTIS (parameterprivilege_levelset to1in the next section).
5. Launching a M&NTIS Lab
We can launch two types of defense testing labs with M&NTIS :
- Basebox labs: labs containing only one virtual machine, to test local attack stimuli.
- Topology labs: labs containing several virtual machines in a virtual network, to test attack stimuli related to lateral movements or depending on environmental context (such as presence of an Active Directory).
In the following examples, we assume that have launched a Windows 10 machine with an automatically installed M&NTIS Redteam beacon. The lab is therefore available for attack stimuli execution.
We can retrieve the launched M&NTIS Redteam beacon session with this command:
Retrieve attack session list:
$ mantis lab 8c53ebce-cc6b-4202-bc85-2ab4d3384011 redteam session list
 [UP] 0: 3348d6bc-279a-478d-a2e2-6c9926209690 - user (privilege user) on basebox (192.168.2.2)
The important part to fetch here is the UUID of the beacon
session: 3348d6bc-279a-478d-a2e2-6c9926209690. It
will be used later to trigger attack stimuli.
6. Testing KQL rules
Let say we want to the test the following KQL rule, that aims at detecting powershell execution containing a base64 encoded command:
Event
| where Source == "Microsoft-Windows-Sysmon"
| where EventID == 1
| extend XmlOuter = parse_xml(EventData)
| extend XmlEventData = XmlOuter.DataItem.EventData
| mv-expand DataField = XmlEventData.Data
| extend KV = pack(
                  tostring(DataField["@Name"]),
                  tostring(DataField["#text"])
              )
| summarize Bag = make_bag(KV)
    by TimeGenerated, Computer
| evaluate bag_unpack(Bag)
| where tostring(Image) endswith "\\powershell.exe"
| where tostring(CommandLine)
    matches regex @"(?i)(-e|-enc|-encodedcommand)\s+[A-Za-z0-9+/=]{20,}"
| extend HostName = Computer
We could use the following Atomic test as attack stimuli to test the previous KQL rule:
$ cat T1059.001.yaml
attack_technique: T1059.001
display_name: 'Command and Scripting Interpreter: PowerShell'
atomic_tests:
- name: PowerShell Command Execution
  auto_generated_guid: a538de64-1c74-46ed-aa60-b995ed302598
  description: |
    Use of encoded command with PowerShell.
  supported_platforms:
  - windows
  executor:
    command: |
      powershell.exe -e VwByAGkAdABlAC0ATwB1AHQAcAB1AHQAIAAiAFQAZQBzAHQAIgA=
    name: command_prompt
To execute this Atomic test through the M&NTIS Redteam beacon session, you have to use the following command:
$ mantis lab 8c53ebce-cc6b-4202-bc85-2ab4d3384011 redteam atomic --session_id 3348d6bc-279a-478d-a2e2-6c9926209690 --atr_file T1059.001.yaml
[+] Execution started
Once the attack stimuli has been executed, you can retrieve the attack report containing the metadata related to the Atomic test execution. With these metadata, we get information such as:
- the timestamps of the attack stimuli execution
- contextual information such as the targeted machine name, username and privilege
- the executed command and its output
The attack report returned by the mantis CLI can be output
as JSON and then piped to jq for better
rendering:
$ mantis lab 8c53ebce-cc6b-4202-bc85-2ab4d3384011 attack-report --json|jq
[
(...)
  {
    "id": 90,
    "source_ids": [],
    "attack_type": "CUSTOM_ATTACK_REPORT",
    "status": "success",
    "started_date": "2026-01-21T15:55:11+00:00",
    "last_update": "2026-01-21T15:55:25+00:00",
    "target_nodes": [
      {
        "node_type": "ATTACK_SESSION",
        "node_info": {
          "ip": "192.168.2.2",
          "type_session": "powershell",
          "privilege_level": "user",
          "session_id": "3348d6bc-279a-478d-a2e2-6c9926209690",
          "username": "user"
        },
        "attack_process_graph": [
          {
            "powershell": {
              "encoded_command": "cABvAHcAZQByAHMAaABlAGwAbAAuAGUAeABlACAALQBlACAAVgB3AEIAeQBBAEcAawBBAGQAQQBCAGwAQQBDADAAQQBUAHcAQgAxAEEASABRAEEAYwBBAEIAMQBBAEgAUQBBAEkAQQBBAGkAQQBGAFEAQQBaAFEAQgB6AEEASABRAEEASQBnAEEAPQA7AA==",
              "decoded_command": "powershell.exe -e VwByAGkAdABlAC0ATwB1AHQAcAB1AHQAIAAiAFQAZQBzAHQAIgA=;",
              "binary": null
            },
            "sh": null,
            "download": null
          }
        ]
      }
    ],
    "output": [],
    "iocs": [],
    "custom_attack": {
      "id": 4,
      "uid": "a538de64-1c74-46ed-aa60-b995ed302598",
      "mitre_tag": "1059_001",
      "title": "PowerShell Command Execution",
      "status": "success",
      "description": "Use of encoded command with PowerShell.\n",
      "command": "powershell.exe -e VwByAGkAdABlAC0ATwB1AHQAcAB1AHQAIAAiAFQAZQBzAHQAIgA=;",
      "output": "Test\r\n"
    }
  }
]
Finally, we can retrive the potentiel triggered alerts from Microsoft Sentinel:
$ mantis lab 8c53ebce-cc6b-4202-bc85-2ab4d3384011 alerts --json |jq
[+] Lab ID: 8c53ebce-cc6b-4202-bc85-2ab4d3384011
[+] Alerts from azure_arc_agent:
  [+] Alert ID: 32a02c6b-5c9d-db40-02be-7ad1523c3f32
      Alert name: Powershell encoded command execution
      Alert status: NEW
      Target: None
      Associated log dates: start:2026-01-21T15:55:23.4076419+00:00 - end:2026-01-21T15:55:23.5959477+00:00
      Correlated attack IDs: [90]
When available, the triggered alerts contain information
regarding the corresponding attack ID in the attack report
above (e.g.: Correlated attack IDs: [90]).
Correspondance of alerts with attack steps is made through
time-based correlation.
Once the Atomic tests have run:
- It may take 1–5 minutes (sometimes longer) for events to appear in Log Analytics and Sentinel.
- Before troubleshooting, wait a short period and then:
- Check query results in Sentinel.
- Confirm that the events generated by the tests are present.
7. Troubleshooting
If you see the test-generated events in Logs but no alerts are triggered:
- Data mismatch:
- Confirm the tables and fields your rule is querying match the events.
- Example: If your rule uses
Sysmonbut onlySecurityEventis populated, it won’t trigger.
- KQL too strict:
- Check for overly restrictive filters (exact match on process path, case-sensitive matches, etc.).
- Temporarily broaden your KQL and rerun the test.
- Rule scheduling:
- Ensure the rule’s schedule and query time window are appropriate.
- Example: Rule runs every 5 minutes and looks back 5 minutes; if ingestion is delayed, it may miss events.
- Test execution problems:
- In M&NTIS, verify that the Atomic test completed successfully.
- Check M&NTIS logs or console output for potential errors from the M&NTIS Redteam beacon
Iterate between:
- Adjusting and re-running the Atomic test in M&NTIS.
- Tuning the rule and re-running queries in Sentinel.
8. Iterating and Improving Detection Rules
Use the insights from the Atomic tests to improve your Sentinel content:
- Adjust detection patterns:
- Add or refine command-line keywords, process names, parent-child process relationships.
- Improve resiliency:
- Add alternative indicators for the same behavior (e.g. event IDs from multiple sources).
- Reduce false positives:
- Add conditions on known legitimate processes, approved paths, or signed binaries.
Re-run the same Atomic tests after each tuning, and confirm:
- Events are still detected.
- False positives are reduced (if that was your goal).
This continual loop is the core of detection engineering.
9. Conclusion: Building a Repeatable Test Suite
By combining M&NTIS Platform, Atomic Red Team, Azure Arc, and Microsoft Sentinel, you can:
- Generate realistic, controlled attack-like activity in a safe lab
- Forward all relevant telemetry directly to Sentinel
- Validate whether your analytics rules actually detect what they’re designed to detect
- Continuously tune and improve your detection coverage
Establish a regular testing cadence:
- After content updates in Sentinel
- After significant environment changes (OS upgrades, new logging policies)
- Quarterly or monthly as part of a detection health check
M&NTIS allows you to easily re-run these suites and compare results over time.