Microsoft Azure Arc Agent
Microsoft Azure Arc Agent
Description
Azure Cloud is the Microsoft's SIEM for log gathering and analysis where the Azure Monitor Agent sends its logs.
Glossary
- Azure Monitor Agent (AMA): it is responsible for monitoring and collecting data from running machines. It then delivers the data to Microsoft service (such as Azure Sentinel, Azure Cloud, and so on).
- Azure Arc: it lets you manage Windows and Linux physical servers and virtual machines hosted outside of Azure, on your corporate network, or other cloud provider. It works as a bridge to Azure.
- Azure Sentinel: it is a cloud native security information and event management (SIEM) and security orchestration, automation, and response (SOAR) solution that runs in the Azure cloud.
- Azure Log Analytics Workspace: it is a data store where you can collect any type of log data from all of your Azure and non-Azure resources and applications.
- Data Collection Rule (DCR): it is a part of an Event Trace Log (ETL)-like data collection process which improves on legacy data collection methods for Azure Monitor.
Configuration
The M&NTIS implementation is compatible with Microsoft's Azure CLI (Command Line Interface). Each machine where Azure Arc Agent is installed from this lab has a tag creator=mantis. The Windows and Linux machines of the simulation are provisioned with the Azure Arc Agent and the Azure Monitor Agent extension enabled. The extension is configured to send logs via a proxy embedded in the lab. Azure has to be configured from the Cloud side and not from the agent.
Note the resource_group you will use and where all the dynamic objects will be created. The geographic location is a mandatory field by Azure. For the example, "francecentral" can be used.
Application registration
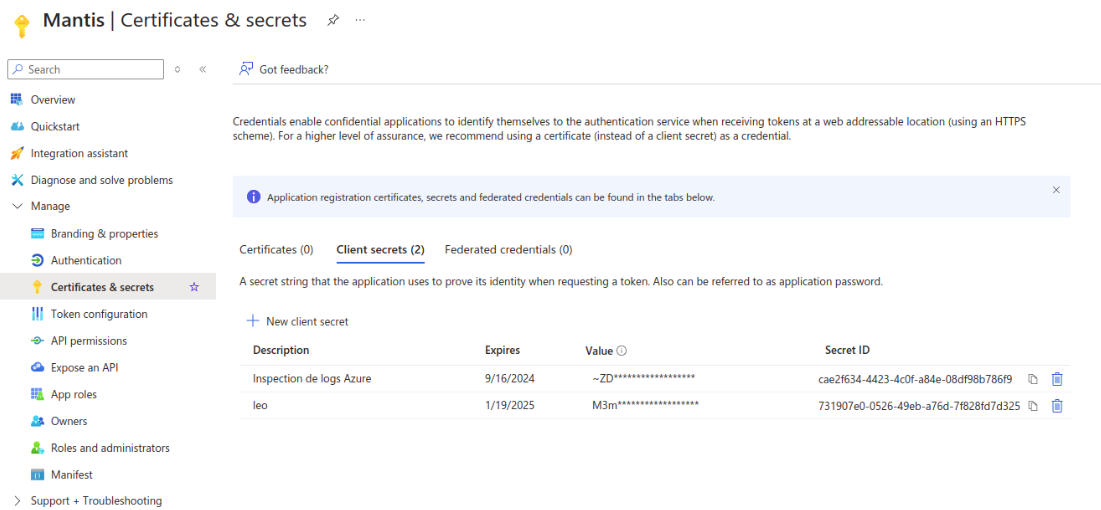
It is expected that an application is created in order to impersonate the main user. To achieve this, go to "App Registrations" -> "New registration". Configure the web redirection URL with "http://localhost" (it won't be used). Validate this app creation and then go to this newly created app. Please note the client_id and Directory ID, known as tenant_id. Then, click on Manage -> Authentication -> Advanced settings. Enable the "Allow public client flows" option. To create a new secret, navigate to Manage -> Certificates and Secrets. Create a new client secret and note this value as client_secret.
In Manage -> API Permission, create a new permission for the Azure Service Management, and choose a delegated permission and check the user_impersonation entry.
Now, navigate to Manage -> App roles, and add both roles:
- Microsoft.Resources/deployments/validate/action
- Microsoft.HybridCompute/machines/extensions/write
It is useful to enable the extension installation as templates from M&NTIS
You need to allow this registered app to your subscription plan (subscription_id). To achieve this, you need to go to the subscription's page. Then, navigate to Access Control (IAM), add your app, and set its role to contributor.
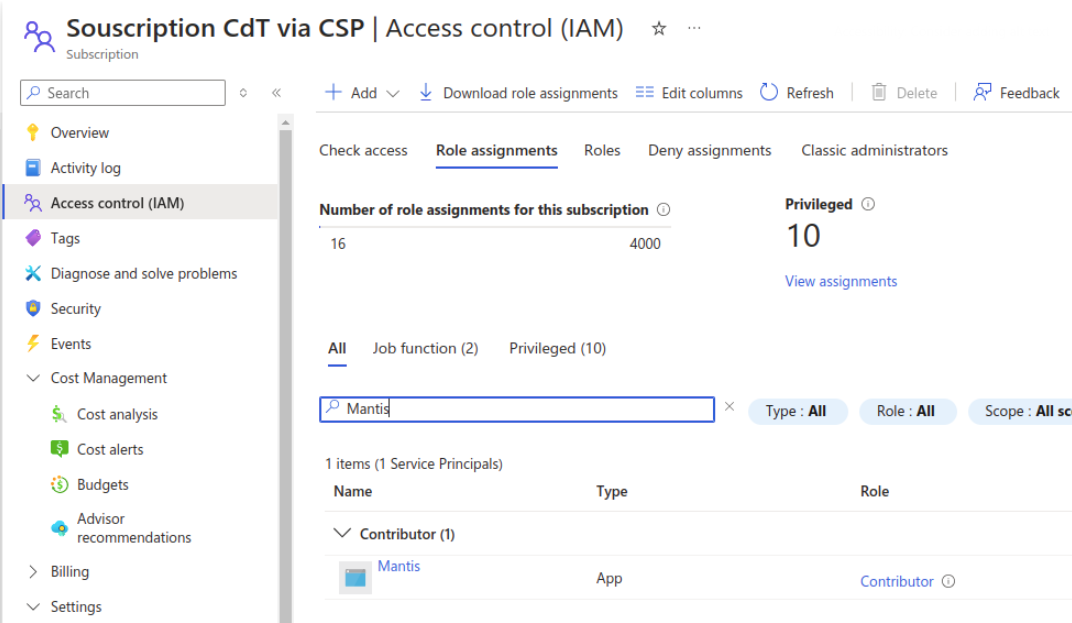
An enterprise application is created. This one is only the interface betweeen the subscription and the application. It won't be used anymore later.
Data Collection Rule (DCR)
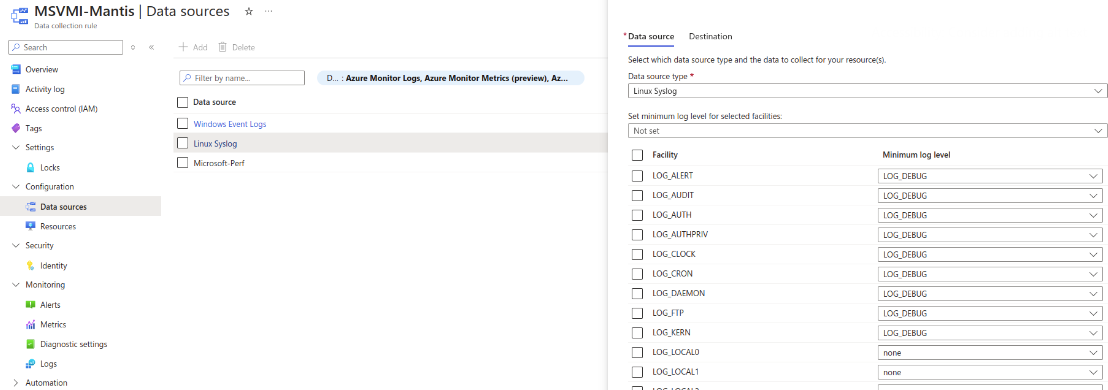
Now it's time to create a Data Collection Rule DCR. This is where logs from the various machines will be sent. Our method will automatically add machines to this DCR, and they will be visible in the resources tab. In our case, this DCR is called MSVMI-Mantis. You need to note this DCR name as data_collector_name. This object must be created by the user before launching a M&NTIS simulation. Indeed, its configuration may differ from one simulation to another. To configure the logs that are collected, you can use the following image as a guide.
Log Analystics Workspace
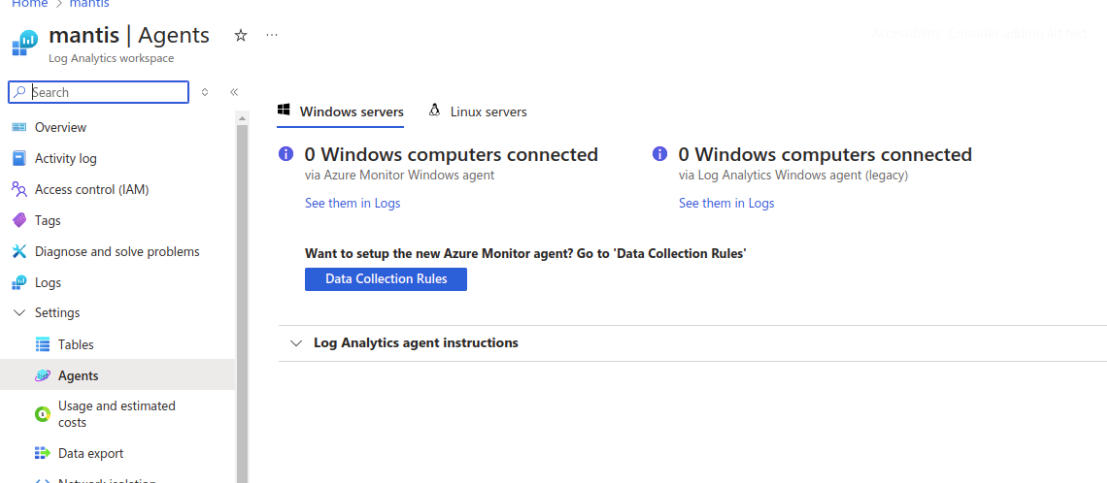
In order to analyze all these logs, we need to create a Log Analytics workspace object. Add the newly created DCR to the Settings -> Agents -> Data Collection Rules tab.
How to enable
In order to use the M&NTIS connector for Azure, the user has 7 different Azure resources to configure. Such resources provide identifiers and tokens which are explained in Configuration
Usage
You can directly go to the main page of the Log Analysis Workspace you created earlier, and select Logs. You should see the logs sent from all the machines where AMA is installed in the lab. Depending on your plan, you can even use Azure Sentinel in order to detect threats.