Sekoia
Sekoia
Description
The Sekoia SOC platform (XDR) has been integrated with M&NTIS Platform. This system receives logs from configured log collectors inside the lab, and can triggers alerts depending on a catalog of detection rules.
Configuration
Currently, the integration is done through a logstash log aggregator launched in M&NTIS labs. The logstash configuration is automatically deployed and only requires, as user input, a Sekoia API key.
To enable Sekoia XDR in your simulation, you need to obtain an API key of Sekoia and provide it as input when configuring a lab.
Usage
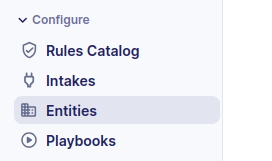
After launching a lab, you need to log in the Sekoia main page in order to view logs and alerts. M&NTIS's integration of Sekoia separates labs in distinct entities. To verify that a new entity has been correctly created for a new M&NTIS lab, select the Entities tab on the left pane.
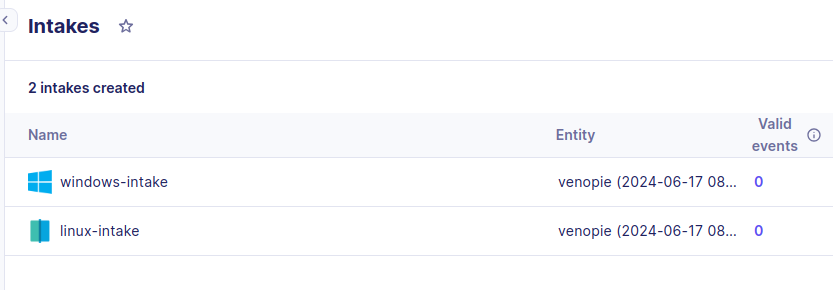
Then, you can see that new intakes have been created for each data source. For example in the Venopie M&NTIS scenario, two intakes were created, for Linux and Windows data sources.
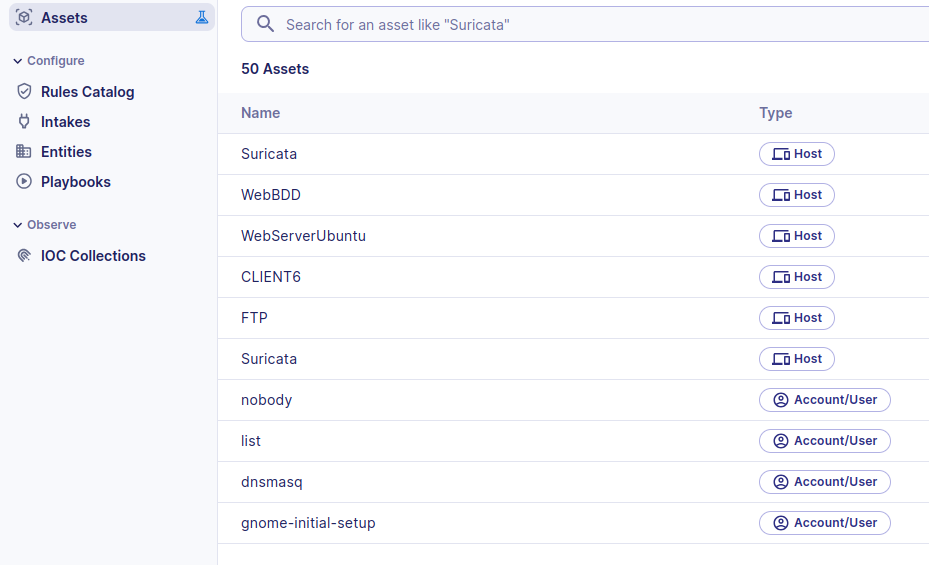
You can check which nodes of the lab are discovered by Sekoia XDR as assets. To achieve this, click on the Assets section. Some extra nodes might be infered by Sekoia's engine.
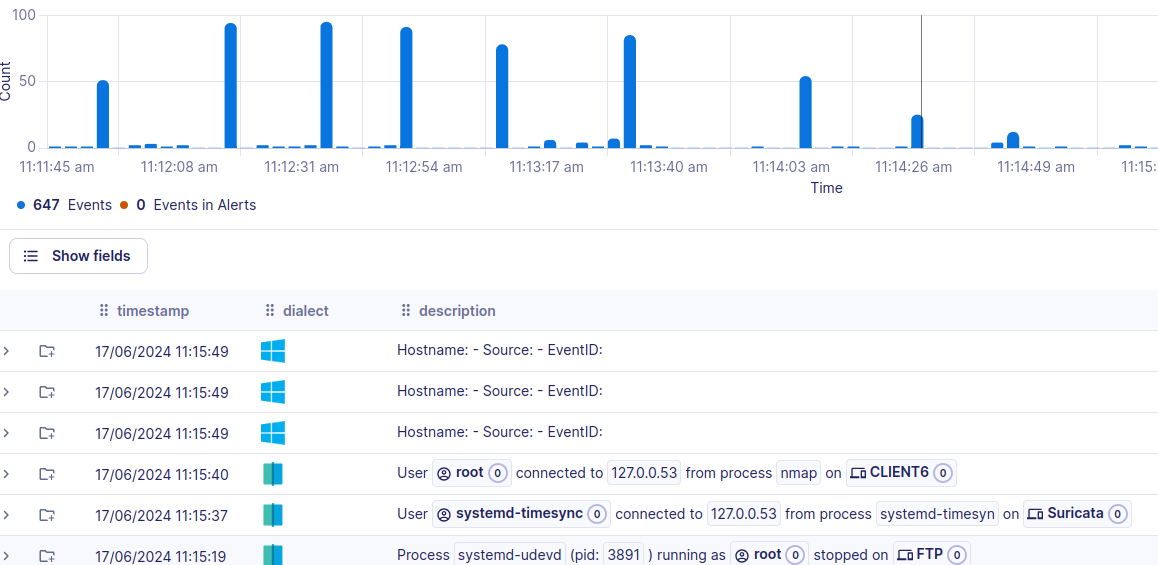
You can check the events in the Events tab on the left pane. In the page, you might need to adjust the time range for the data. By default, Last 5 minutes is selected, but we recommand to choose Last hour in order to have an overview of the produced logs during the timeframe of the scenario execution.
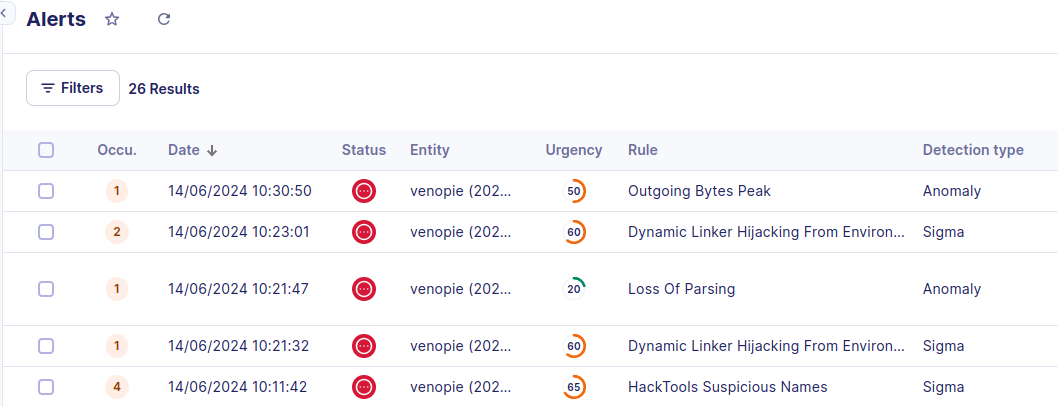
In the same manner, you can see Alerts by selecting Alerts in the left pane, in order to analyze alerts produced during scenario execution.