Dashboard
Introduction
Once logged in, the following page appears.
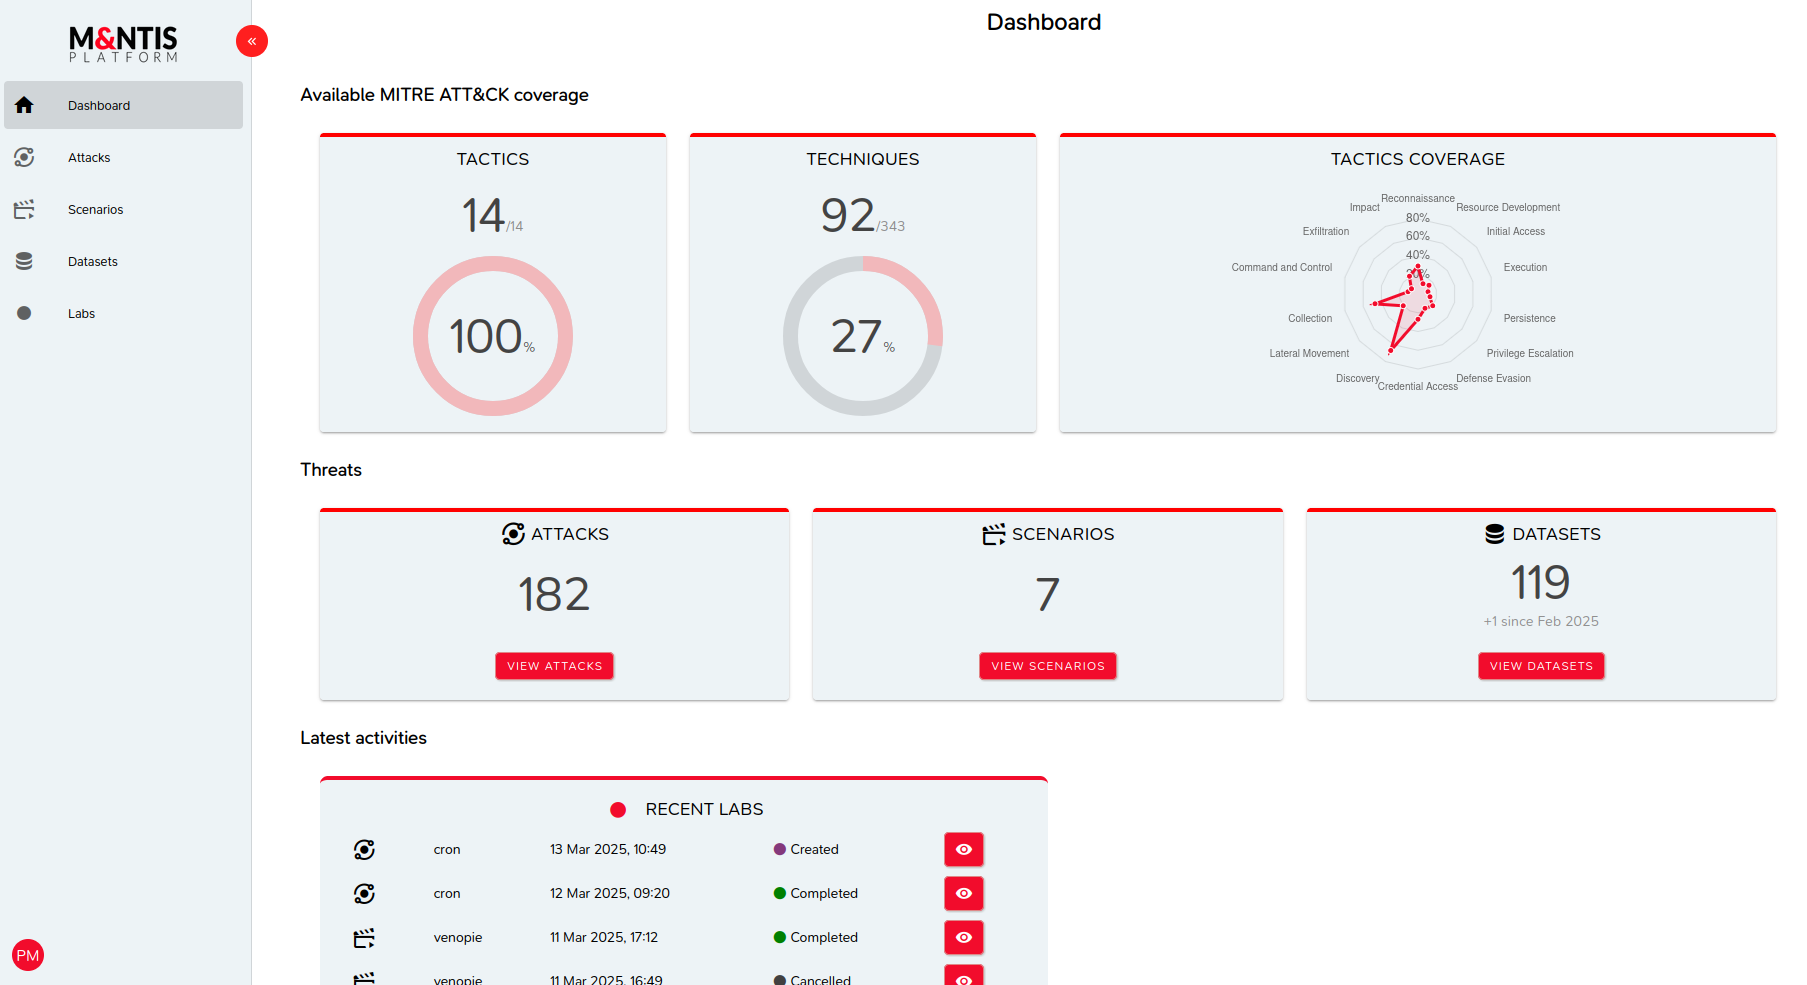
It is the home page of the application and can be accessed at any time by clicking on the M&NTIS Platform logo at the top left of the screen:
The contents of this page are as follows:
- On the left is a vertical menu giving access to the application's main functions,
- To the right of this menu is a dashboard showing:
MITRE ATT&CK matrix coverage
Each attack available within M&NTIS Platform represents the implementation of a technique or sub-technique of the MITRE ATT&CK, each technique or sub-technique belonging to a given tactic.
The overall coverage of the MITRE ATT&CK matrix is therefore represented by the following information.
The number of tactics covered
A tactic is considered to be covered as soon as there is an attack associated with it.
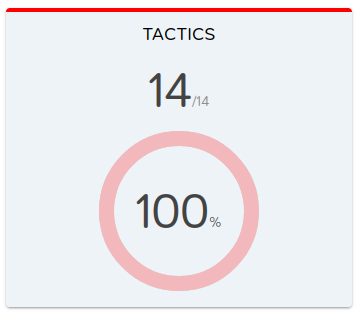
Coverage is indicated by the number of tactics covered / the total number of existing tactics and the corresponding percentage value.
The number of techniques covered
A technique is considered to be covered as soon as there is an attack associated with it or one of its sub-techniques.
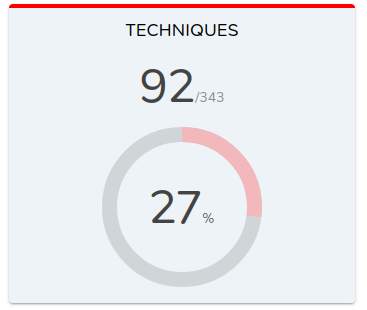
Coverage is indicated by the number of techniques covered / the total number of existing techniques and the corresponding percentage value.
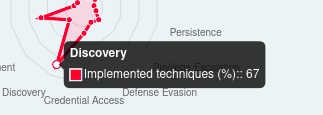
Coverage by tactic
A Radar diagram is used to represent the coverage of each tactic in the MITRE ATT&CK.
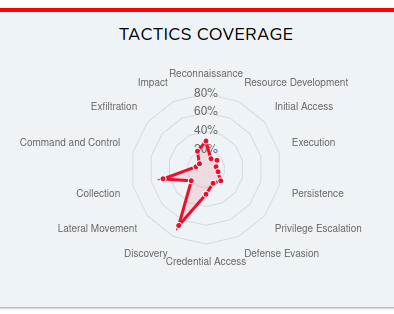
Each axis of the diagram represents the name of a tactic, and each circle a given percentage, from 0 to 100% in increments of 20%.
By hovering the mouse over the point on the graph corresponding to a given tactic, it is possible to obtain the exact value of the coverage (67% in the example below):
Information on threats
The ‘Threats’ banner shows the total number of threats implemented in M&NTIS Platform:
Total number of attacks
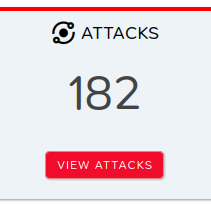
The number of new attacks implemented since the last update is indicated (in the example, 81 new attacks since January 2025).
Click on the "VIEW ATTACKS" button to access the list of available attacks.
Total number of scenarios
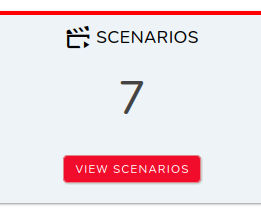
Click on the ‘VIEW SCENARIOS’ button to access the list of available scenarios.
Total number of datasets
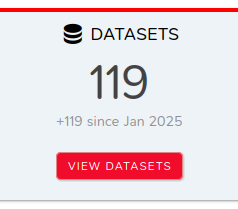
The number of new datasets implemented since the last update is indicated (in the example, 119 new datasets since January 2025).
Click on the "VIEW DATASETS" button to access the list of available datasets.
Latest activities
The "Latest Activities" banner displays the results of the most recent labs.
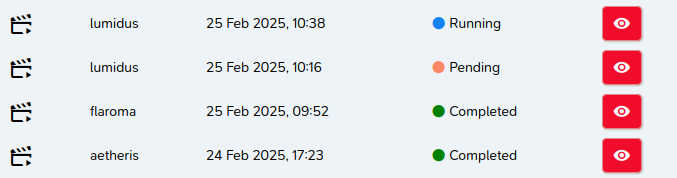
Each line represents the result of a lab, indicating, from left to right:
- The type of lab ("Scenario" type for the first line of the example),
- The name of the lab (‘lumidus’ for the first line of the example),
- The date corresponding to the last change of state ("25 February 2025 at 10:38" for the first line of the example),
- The state of the lab ("Running" for the first line of the example),
- A button to access the lab details.
This information is detailed in the section dedicated to labs.