Splunk
Splunk
Description
The Splunk SIEM can be deployed within the simulation as a docker node. In M&NTIS, ELK BEAT agents (auditbeat and winlogbeat+sysmon) are used to collect data on the deployed machines, then Logstash drives them to the Splunk node.
Configuration
The configuration of Splunk in M&NTIS contains the default settings from the public Splunk image. The admin password is set to :code:AmossysSPLUNK35;, used to access to the Splunk web interface.
How to enable
To enable Splunk, you need to activate:
- Auditbeat agent (for Linux nodes)
- Sysmon and Winlogbeat agents (for Windows nodes)
- Logstash (can not be unselected)
- Splunk log aggregator
Usage
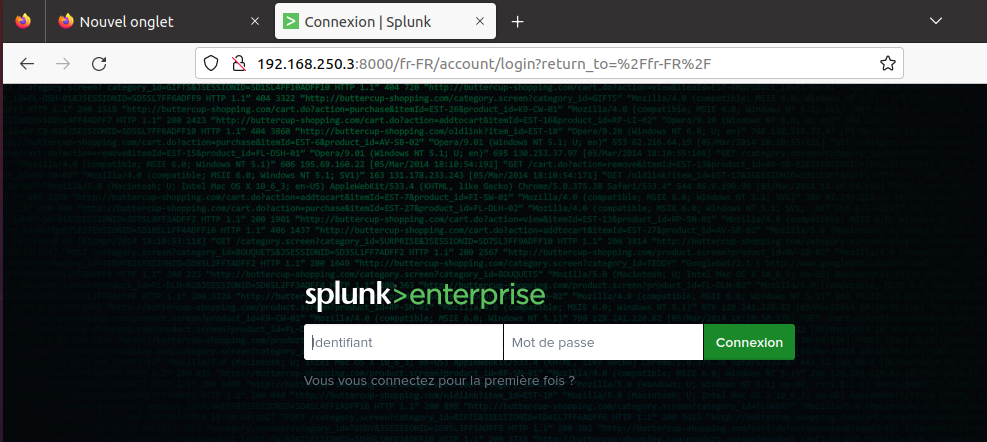
Once the simulation is running, you can access the Splunk interface by clicking on the Information tab. Then, you can connect to the Splunk Server using the link displayed for this SIEM in the Security monitoring and collaborative tools category.
The Splunk web interface should appear, you can log in using the credentials :code:admin:AmossysSPLUNK35;:
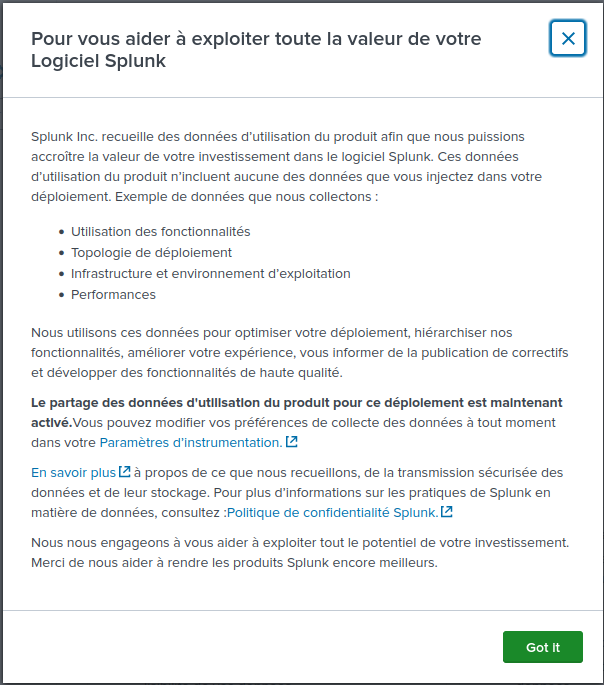
Now you have to close the "Data Sharing" popup :
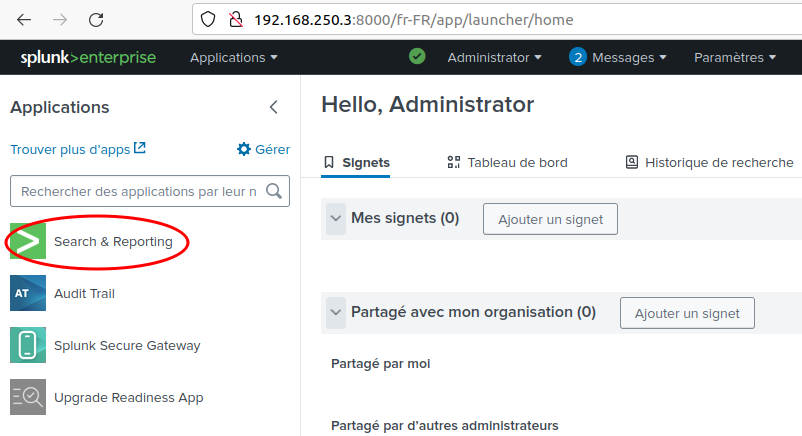
To see data events, on the home page click on "Search & Reporting":
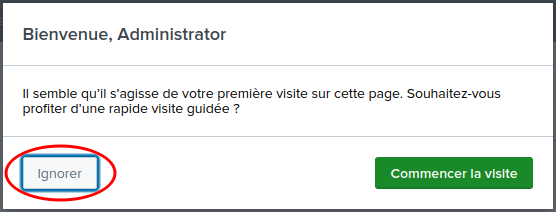
You may close the "1st Visit" popup:
And skip introduction:
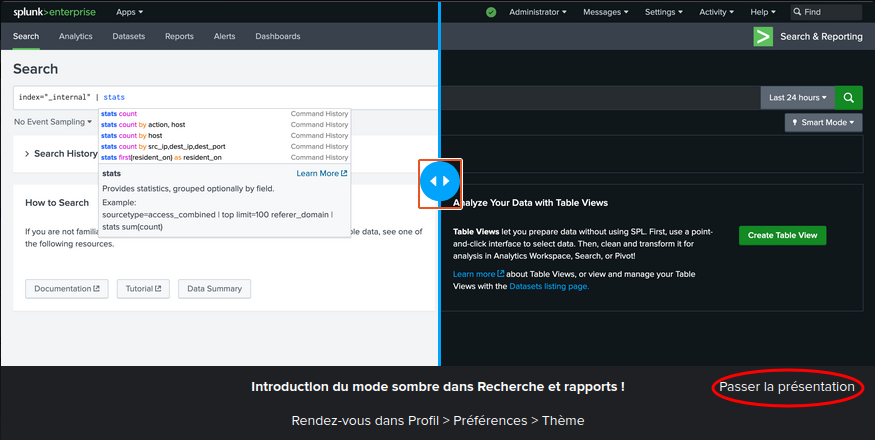
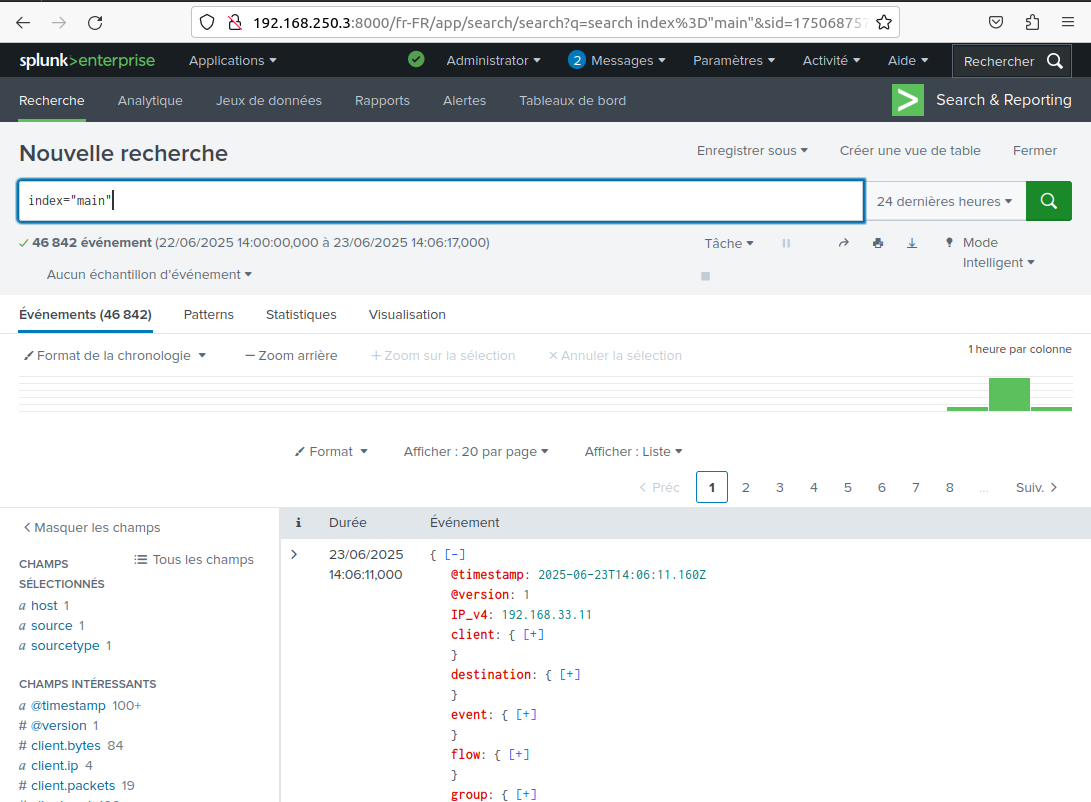
The main index references the events, so type :code:index="main" in the search bar and validate: