SOC analyst training with M&NTIS Platform
This tutorial outlines the process for user M&NTIS Platform Labs to train SOC analysts. The goal of this training is to upskill a team of SOC analysts in mastering investigation and attack detection procedures. Training sessions are conducted autonomously with a facilitator who has access to M&NTIS Platform. The SOC analysts participate in the training through automatically configurable security monitoring tools (such as an EDR console or SIEM), and they receive a public link that provides contextual information about the monitored IT system.
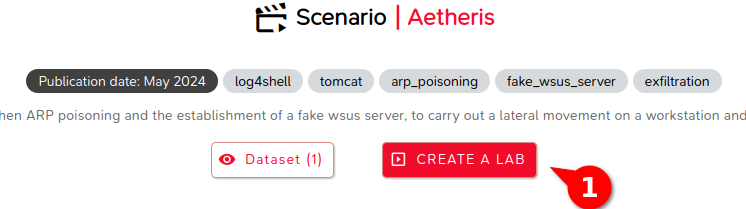
Choosing the Scenario
Select an attack scenario based on the training objectives and the threat you want to study. For example, the choice of scenario can be based on:
- The impact in terms of the attacker’s goal (e.g., ransomware).
- The simulation of TTPs from a known intrusion set (e.g., DarkPink).
- Exploitation of vulnerabilities (e.g., Log4Shell).
Once the scenario is selected, click on the Lab creation button (1).
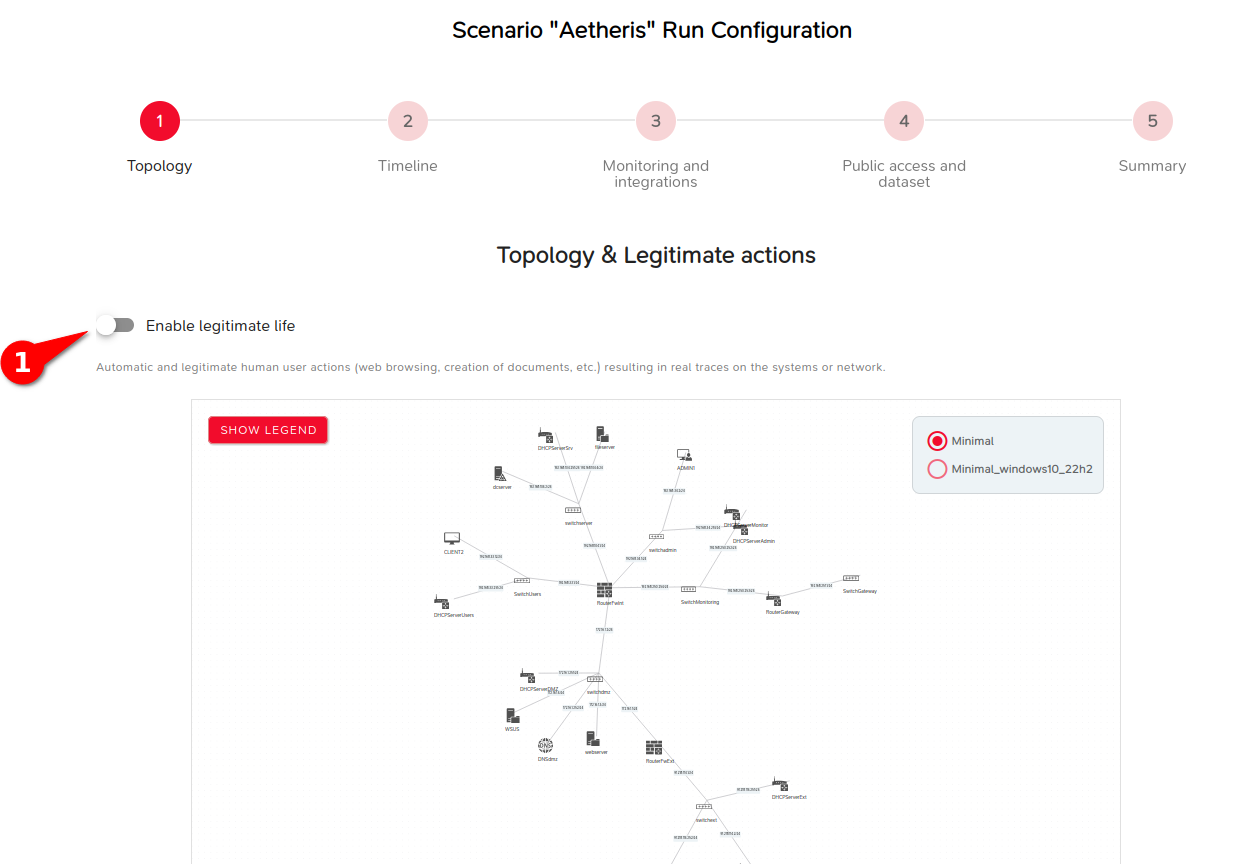
Information on the Simulated IT System
In the Lab configuration menu, the first screen provides information on the monitored IT system:
- Visualization of the topology: Display the network topology simulated in M&NTIS to see the systems affected by the attack.
- Selection of background noise and user activity (1): Configure user activities to simulate a realistic environment. This can include actions such as logins, file access, web browsing, etc.
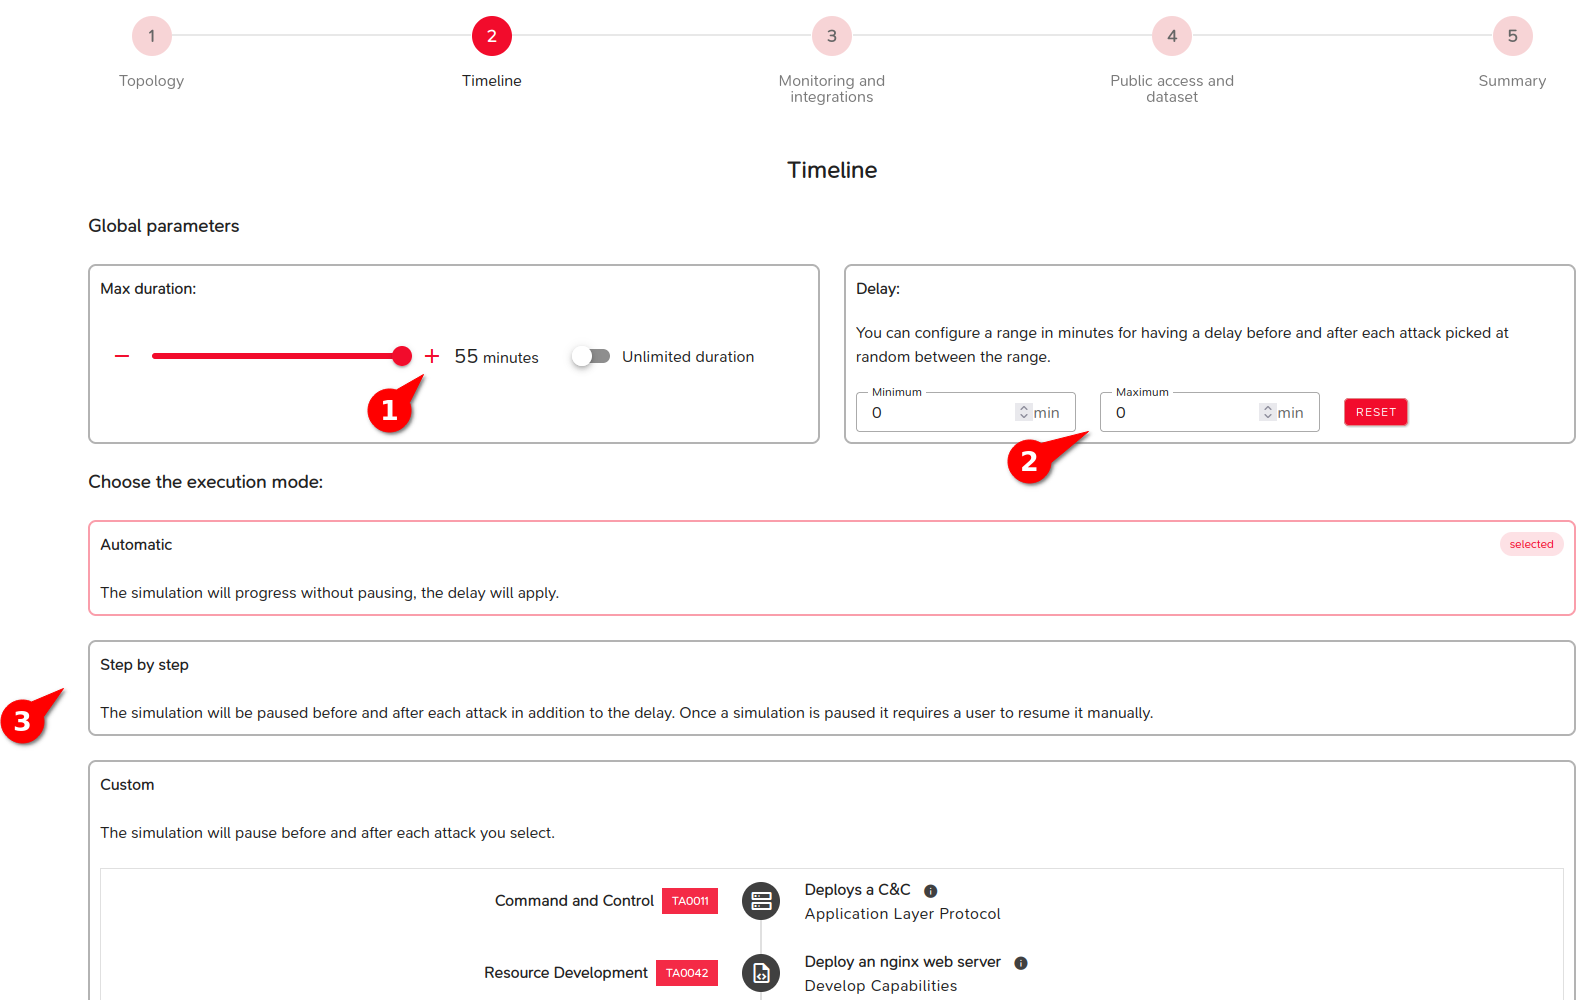
Timeline Configuration
In the next screen of the Lab configuration, you can adjust the duration of the lab and the scenario’s timeline:
- Configuration of the overall lab duration (1): For a training use case, it is preferable to select “Unlimited duration” so as not to be constrained by the lab's duration. Once the training is completed, you can then shut down the Lab.
- Configuration of the delay between attack steps (2): Configure a delay between each stage of the attack to allow participants time to conduct an investigation after each event.
- Configuration of pauses (3): You can also choose to pause at each stage or at specific points to control the sequence of attack steps in the scenario.
For example, a pause at the first stage of the scenario is strongly recommended to allow for manual customization of the Lab.
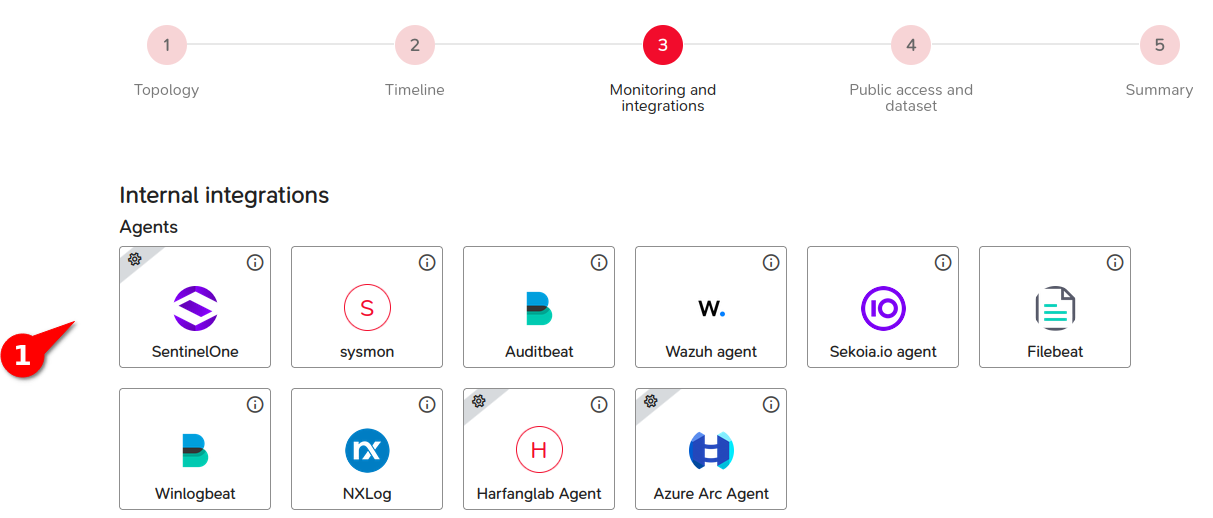
Security Monitoring Configuration
In the next screen of the Lab configuration, you can set up the security monitoring chain. This section allows you to select defense integrations to be automatically deployed for implementing a complete security monitoring chain (log collection, EDR, logs sinks, SIEM, and visualization console).
- Deployment of agents: Choose the monitoring agents (1) you want to deploy on the IT system. Once selected, the agent will be automatically installed on all compatible machines and systems. If an EDR (Endpoint Detection and Response) agent is selected, it will be deployed on all machines (compatible desktops and servers).
- Monitoring with Cloud SIEM: If a existing cloud SIEM (external to the lab) is selected, analysts will access the SIEM console from their workstation.
- Monitoring with SIEM internal to the lab: If a SIEM is deployed within the simulated system, it is necessary to add a consultation workstation to allow analysts to access the SIEM console. Depending on the number of participants, plan for an additional consultation workstation for each participant, as well as potentially one for the facilitator.
See the Configure defense section for more information on configuring security monitoring.
Finalizing the Lab Creation
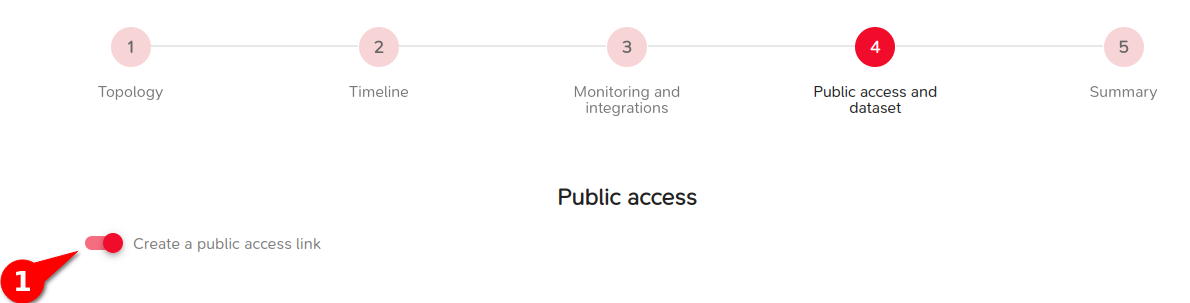
In the next screen of the Lab configuration, it is advisable to enable a public link that allows analysts to access a situational page for the training.
- Activating the public link (1): Create a public link to allow participants to connect to the lab platform and follow the facilitator’s instructions.
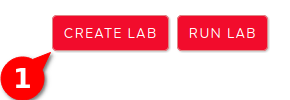
Finally, the last screen provides a summary of the selected Lab configuration. Then click on the Lab creation button (1).
Launching and Preparing the Lab
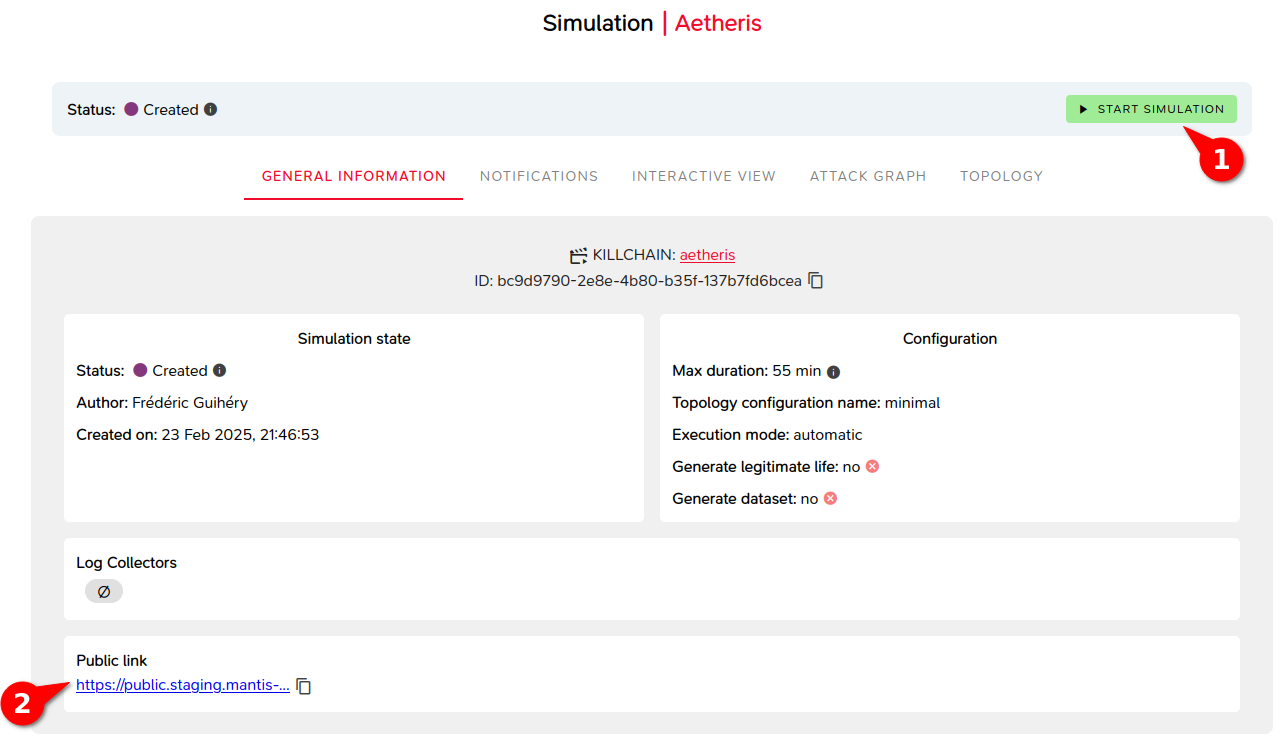
The Lab is launched using the Lab start button (1).
Once the Lab is started, if it was configured to pause at the first stage of the scenario, you can then customize the Lab using tools like Ansible playbooks to automate certain actions. For example, you can deploy a specific EDR agent that is not in the M&NTIS catalog. A specific tutorial on creating and using Ansible playbooks with M&NTIS is available.
For the security monitoring, you have several options:
- Optional configuration of signatures in the SIEM: You can manually add signatures to the SIEM so that it can detect certain stages of the attack. This process creates investigation starting points in the form of alerts on the SOC side.
- Context page (2): Before or at the beginning of the training, you can provide participants with a context page giving information about the monitored IT system, which allows them to interact with the simulated machines once the Lab is created.
Training Session
Through the public link provided by the facilitator, participants can now access the platform to begin the investigation.
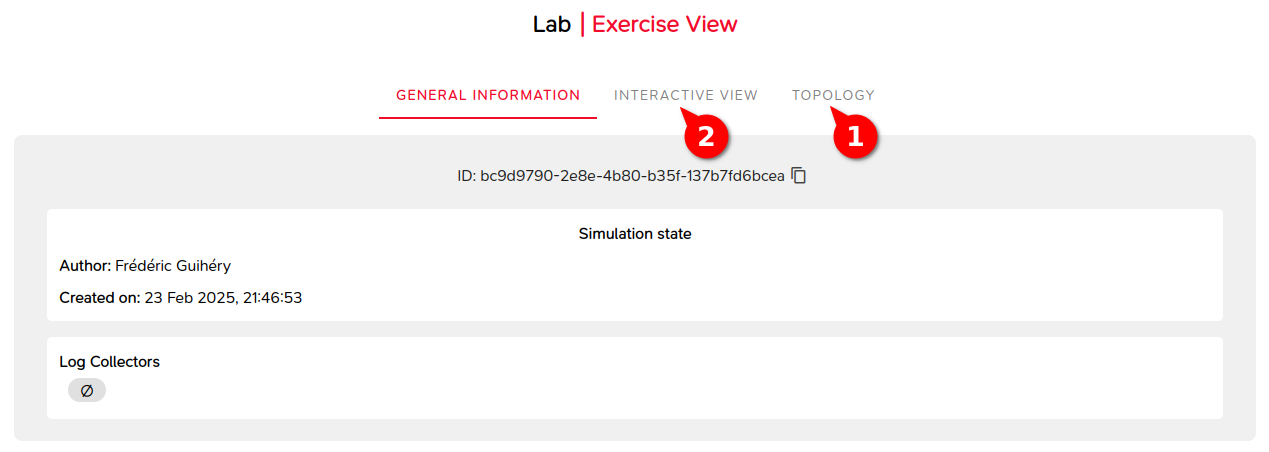
Participants have access to:
- Some metadata on the lab: creation date, information related to the security monitoring chain.
- A topological view of the IT system (1).
- An interactive view allowing interaction with virtual machines (2) directly via the browser or through a SPICE display redirection client.
As a starting point for the investigation, analysts can rely on alerts generated in the SIEM/EDR based on the signatures activated or already present.
Debrief Phase
Once the investigation is completed, the facilitator can use the M&NTIS platform to conduct a debriefing phase, using the following views:
- Topology with attack path: The Lab’s topological view shows the path taken by the attacker and details the steps followed.
- Attack graph: The attack graph view allows visualization of the attacker’s movements in the network and the entry points used.
Once the training is completed, the Lab can then be shut down.